Moose Sightings in North America in 2023
-
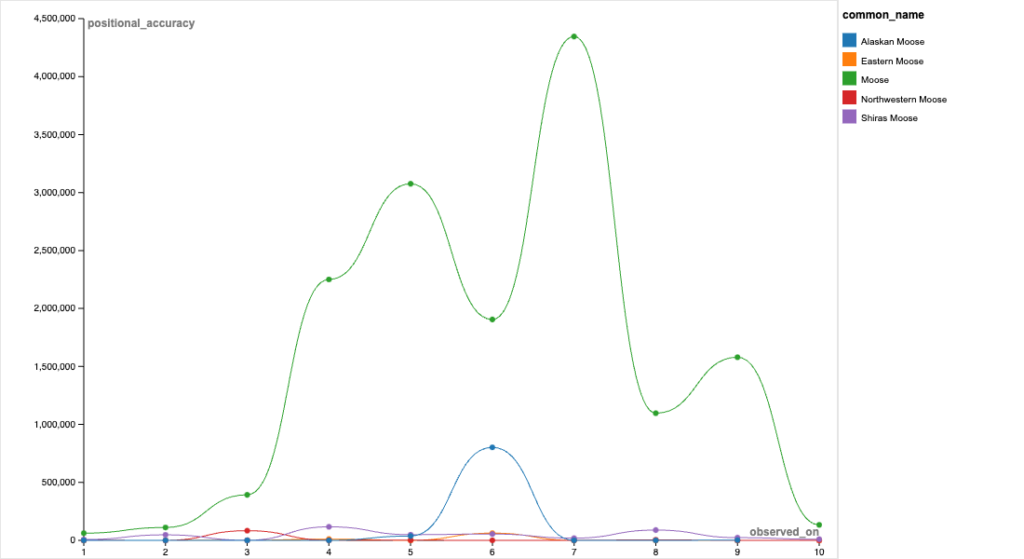
NOTE: The numbers below represents the number correlation of the months in 2023October 26, 2023
Introduction
This Digital Humanities project is dedicated to the exploration and presentation of moose sightings in North America during the year 2023. The primary goal is to visualize and analyze the positional discrepancy and distribution of five different moose species. Through the use of digital tools and techniques, the project aims to offer a comprehensive understanding of moose behavior and their interaction with the environment.
Source: The dataset used for this project encompasses moose sightings data, including the positional discrepancy, species, latitude, and longitude. It was collected from various sources that tracked wildlife observations over several years, with records extending from 1943 to 2023. To streamline the analysis, the dataset was refined to focus exclusively on the year 2023 and the moose species observed during that time.
Process:
- Data Selection: To narrow the scope of the project, records from years other than 2023 were excluded, leaving only the data pertaining to moose sightings in that specific year.
- Data Cleaning: A rigorous data cleaning process was executed to eliminate rows with formatting errors, missing values, and inconsistencies. Furthermore, the sightings for wolves species where excluded along side the longitudes, latitudes and guesses. This ensured the dataset’s accuracy and reliability of what I wanted portrayed.
- Digital Humanities Methods: Digital Humanities techniques were employed for data analysis and visualization. These methods allowed for a more artistic and humanistic representation of the data. The dataset is very easy to read and understand with no clutter
Presentation
The website design for this project was chosen with the aim of providing an engaging and informative experience for users. The following design decisions were made:
- Header Design: The project’s header was meticulously designed to provide an immediate understanding of its focus and content. Users can quickly grasp the essence of the project.
- Data Visualization: To enhance user comprehension, the moose sightings data for 2023 was presented through visually striking and informative graphs and illustrations by color coding the species of moose. These visuals effectively communicated the distribution and positional discrepancies of different moose species throughout the year.
- User-Friendly Interface: The website was designed with user-friendliness in mind to ensure easy navigation, fostering accessibility and user engagement.
Significance
The dataset used in this project provides valuable insights into the distribution and movement patterns of different moose species during 2023. Researchers, conservationists, and wildlife enthusiasts can benefit from this data to gain a deeper understanding of moose behavior and anticipate the discrepancy from the actual location. Furthermore, if you love to look at moose then for example, July would be the time!
This project particularly is significant in the context of Digital Humanities as its innovative approach to data visualization incorporates artistic and humanistic elements into the presentation of this data, making it more engaging and accessible to a broader audience. The creative use of digital tools and techniques not only conveys information but also fosters to all types of audience
However, it’s important to acknowledge the potential pitfalls and limitations associated with the dataset. These may include issues related to data accuracy and misinterpretation of data set are common challenges when working with wildlife sighting datasets.
Process describing the DH methods used and steps taken
I utilized the RawGraphs tool for its simplicity and effectiveness in creating visually compelling representations of the dataset. RawGraphs allowed me to transform the raw data into easily interpretable graphs and illustrations that conveyed the distribution and positional discrepancies of different moose species throughout 2023. The decision to focus on positional accuracy stemmed from the goal of understanding the spatial behavior of moose, providing insights into their movement patterns and potential environmental interactions. While the choice of RawGraphs facilitated a user-friendly interface and enhanced data visualization, the emphasis on positional accuracy was driven by the project’s aim to offer a comprehensive understanding of moose behavior beyond mere frequency of sightings.